Property Record
40774 Brentwood Dr, Sterling Heights, MI 48310


NEARBY LISTINGS FOR SALE OR LEASE
Property Detail
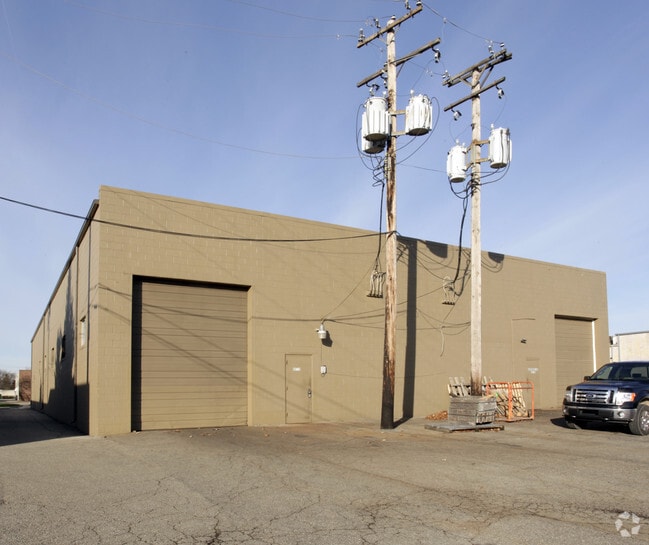
40774 Brentwood Dr
Detroit-Warren-Dearborn, MI
Parkridge Industrial Sub
10-10-17-226-007
M 12 $PARKRIDGE INDUSTRIAL SUB. NO. 1" LOT 12
Industrialgeneral
Macomb
X
Michigan
26099C0308G
12
2025
0.99 AC
2025
W of Van Dyke/Macomb
230800
Detroit
12,800 SF
DEMOGRAPHICS near 40774 Brentwood Dr
1 Mile
3 Mile
5 Mile
2024 Total Population
8,468
95,914
248,459
2029 Population
8,322
94,531
245,590
Pop Growth 2024-2029
(1.72%)
(1.44%)
(1.15%)
Average Age
41
41
42
2024 Total Households
2,837
35,946
97,700
HH Growth 2024-2029
(1.76%)
(1.49%)
(1.17%)
Median Household Inc
$73,403
$76,836
$74,182
Avg Household Size
2.90
2.60
2.50
2024 Avg HH Vehicles
2.00
2.00
2.00
Median Home Value
$261,953
$254,613
$249,801
Median Year Built
1985
1976
1977
Nearby Places
Map Layers
Map Styles
 Street
 Aerial
- Restaurants
- Banks
- Shops
- Fitness
- Groceries
PUBLIC TRANSPORTATION
AIRPORT
Windsor International
DRIVE
WALK
Distance
Windsor International
55 min
32.2 mi
Detroit Metro Wayne County
DRIVE
WALK
Distance
Detroit Metro Wayne County
59 min
41.7 mi
Nearby Properties
Address
Land Use
TOTAL SIZE
Lot Size
Zoning
Address
Land Use
TOTAL SIZE
Lot Size
Zoning
920,611 SF
M-2
Address
Land Use
TOTAL SIZE
Lot Size
Zoning
1,024,233 SF
287.20 AC
M-2
Address
Land Use
TOTAL SIZE
Lot Size
Zoning
2,726,159 SF
199.39 AC
M-2
Address
Land Use
TOTAL SIZE
Lot Size
Zoning
40.32 AC
RM-2
Address
Land Use
TOTAL SIZE
Lot Size
Zoning
146.36 AC
MHP
Address
Land Use
TOTAL SIZE
Lot Size
Zoning
2,727,131 SF
155.26 AC
M-2
Address
Land Use
TOTAL SIZE
Lot Size
Zoning
92.30 AC
MHP
Address
Land Use
TOTAL SIZE
Lot Size
Zoning
2,058,062 SF
141.65 AC
M-2
Address
Land Use
TOTAL SIZE
Lot Size
Zoning
46.56 AC
CK MAP
Address
Land Use
TOTAL SIZE
Lot Size
Zoning
283,249 SF
M-2
Address
Land Use
TOTAL SIZE
Lot Size
Zoning
1,150 SF
25.68 AC
CK MAP
Address
Land Use
TOTAL SIZE
Lot Size
Zoning
2,984,492 SF
M-2
Address
Land Use
TOTAL SIZE
Lot Size
Zoning
423,027 SF
46.73 AC
M-1
Address
Land Use
TOTAL SIZE
Lot Size
Zoning
242,857 SF
9.61 AC
RM-3
Address
Land Use
TOTAL SIZE
Lot Size
Zoning
34.43 AC
CK MAP
Address
Land Use
TOTAL SIZE
Lot Size
Zoning
25.18 AC
RM-2
Address
Land Use
TOTAL SIZE
Lot Size
Zoning
41.09 AC
R-7
Address
Land Use
TOTAL SIZE
Lot Size
Zoning
203,282 SF
17.13 AC
C-2
Address
Land Use
TOTAL SIZE
Lot Size
Zoning
201,873 SF
M-1
Address
Land Use
TOTAL SIZE
Lot Size
Zoning
559,929 SF
41.57 AC
M-1
Address
Land Use
TOTAL SIZE
Lot Size
Zoning
255,070 SF
20.33 AC
RM-2
Address
Land Use
TOTAL SIZE
Lot Size
Zoning
29.93 AC
RM-2
Address
Land Use
TOTAL SIZE
Lot Size
Zoning
210,000 SF
M-1
Address
Land Use
TOTAL SIZE
Lot Size
Zoning
29.39 AC
CK MAP
Address
Land Use
TOTAL SIZE
Lot Size
Zoning
159,750 SF
16.76 AC
M-1
Address
Land Use
TOTAL SIZE
Lot Size
Zoning
1,350 SF
21.90 AC
CK MAP
Address
Land Use
TOTAL SIZE
Lot Size
Zoning
106,130 SF
5.37 AC
O-2
Address
Land Use
TOTAL SIZE
Lot Size
Zoning
554,374 SF
22.15 AC
M-2
Address
Land Use
TOTAL SIZE
Lot Size
Zoning
200,000 SF
17.66 AC
M-2
Address
Land Use
TOTAL SIZE
Lot Size
Zoning
21.03 AC
RM-2
The World's #1 Commercial Real Estate Marketplace
Connect with us
© 2025 CoStar Group
The information above has been obtained from sources believed reliable. While we do not doubt its accuracy we have not verified it and make no guarantee, warranty or representation about it. It is your responsibility to independently confirm its accuracy and completeness. Any projections, opinions, assumptions, or estimates used are for example only and do not represent the current or future performance of the property. The value of this transaction to you depends on tax and other factors which should be evaluated by your tax, financial, and legal advisors. You and your advisors should conduct a careful, independent investigation of the property to determine to your satisfaction the suitability of the property for your needs.