Property Record
675 E 2100 S, Salt Lake City, UT 84106


NEARBY LISTINGS FOR SALE OR LEASE
Property Detail
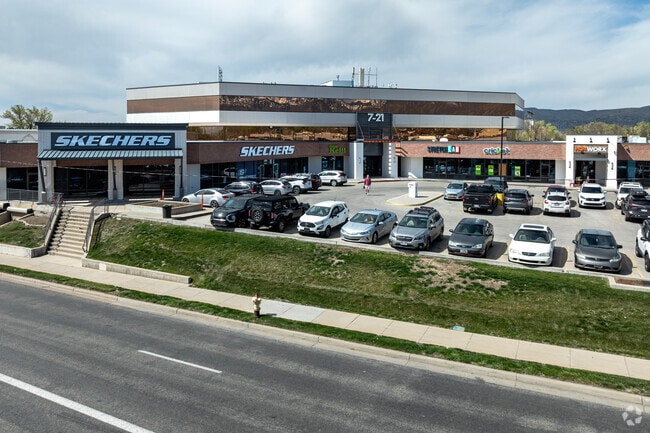
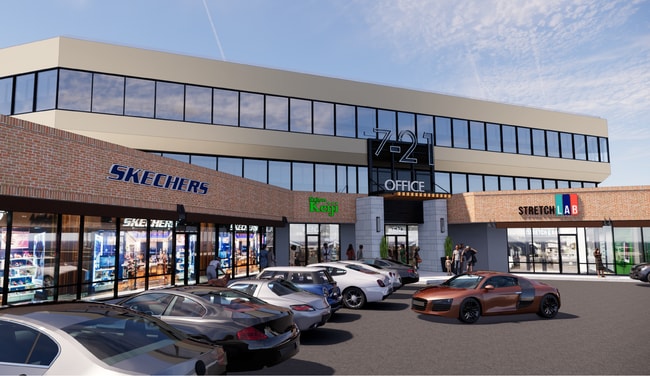
675 E 2100 S
Salt Lake City, UT
Big Field Sur
16-20-101-005-0000
BEG W 62.93 FT FR SE COR LOT 1, BLK 3, 5 AC PLAT A, BIG FIELD SUR; W 457.82 FT; N 287.1 FT; E 355.75 FT; S 57.75 FT;E 102.07 FT; S 229.35 FT TO BEG. 6414-234 6048-517 5800-2636, 2633 5796-2300, 2290, 2284 5626-1051, 1049 5062-799 5063-213 5714-2741 4
Stripcommercialcenter
Salt Lake
X
Utah
49035C0301H
1
2024
2.89 AC
2024
Sugarhouse
103200
Salt Lake City
188,707 SF
DEMOGRAPHICS near 675 E 2100 S
1 Mile
3 Mile
5 Mile
2024 Total Population
23,679
154,923
347,236
2029 Population
23,983
157,194
351,944
Pop Growth 2024-2029
+ 1.28%
+ 1.47%
+ 1.36%
Average Age
38
37
37
2024 Total Households
11,201
69,245
144,929
HH Growth 2024-2029
+ 1.54%
+ 1.76%
+ 1.66%
Median Household Inc
$66,790
$65,292
$65,599
Avg Household Size
2.00
2.10
2.30
2024 Avg HH Vehicles
2.00
2.00
2.00
Median Home Value
$462,005
$493,412
$479,125
Median Year Built
1958
1964
1972
Nearby Places
Map Layers
Map Styles
 Street
 Aerial
- Restaurants
- Banks
- Shops
- Fitness
- Groceries
PUBLIC TRANSPORTATION
TRANSIT/SUBWAY
700 East Station (S-Line - Utah Transit Authority (UTA))
DRIVE
WALK
Distance
700 East Station (S-Line - Utah Transit Authority (UTA))
0 min
5 min
0.3 mi
500 East Station (S-Line - Utah Transit Authority (UTA))
DRIVE
WALK
Distance
500 East Station (S-Line - Utah Transit Authority (UTA))
2 min
9 min
0.5 mi
Sugarmont Station (S-Line - Utah Transit Authority (UTA))
DRIVE
WALK
Distance
Sugarmont Station (S-Line - Utah Transit Authority (UTA))
2 min
11 min
0.6 mi
Fairmont Station (S-Line - Utah Transit Authority (UTA))
DRIVE
WALK
Distance
Fairmont Station (S-Line - Utah Transit Authority (UTA))
2 min
14 min
0.8 mi
300 East Station (S-Line - Utah Transit Authority (UTA))
DRIVE
WALK
Distance
300 East Station (S-Line - Utah Transit Authority (UTA))
2 min
15 min
0.8 mi
COMMUTER RAIL
North Temple Station (FrontRunner - Utah Transit Authority (UTA))
DRIVE
WALK
Distance
North Temple Station (FrontRunner - Utah Transit Authority (UTA))
11 min
6.5 mi
Warm Springs Relief Point (FrontRunner - Utah Transit Authority (UTA))
DRIVE
WALK
Distance
Warm Springs Relief Point (FrontRunner - Utah Transit Authority (UTA))
12 min
7.9 mi
AIRPORT
Salt Lake City International
DRIVE
WALK
Distance
Salt Lake City International
15 min
10.5 mi
Freight Ports
Port of Stockton
DRIVE
WALK
Distance
Port of Stockton
715 min
700.9 mi
SALE & LEASE HISTORY
LISTING DATE
SALE/LEASE

Sep 25, 2016
For Lease
Oct 05, 2018
For Lease
Mar 20, 2019
For Lease
Mar 01, 2023
For Lease
Mar 01, 2023
For Lease
Jul 25, 2017
For Lease
Dec 29, 2022
For Lease
Apr 03, 2017
For Lease
Nearby Properties
Address
Land Use
TOTAL SIZE
Lot Size
Zoning
Address
Land Use
TOTAL SIZE
Lot Size
Zoning
591,924 SF
80.77 AC
I
Address
Land Use
TOTAL SIZE
Lot Size
Zoning
1,262,865 SF
44.15 AC
I
Address
Land Use
TOTAL SIZE
Lot Size
Zoning
365,253 SF
33.64 AC
I
Address
Land Use
TOTAL SIZE
Lot Size
Zoning
56,741 SF
1.70 AC
D-1
Address
Land Use
TOTAL SIZE
Lot Size
Zoning
87,933 SF
4.90 AC
D-1
Address
Land Use
TOTAL SIZE
Lot Size
Zoning
2,566,335 SF
10.01 AC
D-1
Address
Land Use
TOTAL SIZE
Lot Size
Zoning
1,330,058 SF
5.02 AC
D2
Address
Land Use
TOTAL SIZE
Lot Size
Zoning
298,628 SF
27.30 AC
I
Address
Land Use
TOTAL SIZE
Lot Size
Zoning
807,940 SF
0.69 AC
D1
Address
Land Use
TOTAL SIZE
Lot Size
Zoning
299,535 SF
38 AC
I
Address
Land Use
TOTAL SIZE
Lot Size
Zoning
254,939 SF
34.68 AC
I
Address
Land Use
TOTAL SIZE
Lot Size
Zoning
712,539 SF
0.01 AC
D1
Address
Land Use
TOTAL SIZE
Lot Size
Zoning
1,256,042 SF
3.50 AC
D-1
Address
Land Use
TOTAL SIZE
Lot Size
Zoning
82,851 SF
9.76 AC
PL2
Address
Land Use
TOTAL SIZE
Lot Size
Zoning
588,291 SF
1.28 AC
D-1
Address
Land Use
TOTAL SIZE
Lot Size
Zoning
434,481 SF
10 AC
D-1
Address
Land Use
TOTAL SIZE
Lot Size
Zoning
497,018 SF
13.11 AC
I
Address
Land Use
TOTAL SIZE
Lot Size
Zoning
163,932 SF
14.65 AC
PL
Address
Land Use
TOTAL SIZE
Lot Size
Zoning
449,528 SF
1.64 AC
2000
Address
Land Use
TOTAL SIZE
Lot Size
Zoning
543,780 SF
0.33 AC
D1
Address
Land Use
TOTAL SIZE
Lot Size
Zoning
737,755 SF
1.63 AC
D-1
Address
Land Use
TOTAL SIZE
Lot Size
Zoning
37,536 SF
10 AC
PL
Address
Land Use
TOTAL SIZE
Lot Size
Zoning
691,463 SF
17.80 AC
RM
Address
Land Use
TOTAL SIZE
Lot Size
Zoning
208,868 SF
20.41 AC
I
Address
Land Use
TOTAL SIZE
Lot Size
Zoning
695,737 SF
1.70 AC
D-1
Address
Land Use
TOTAL SIZE
Lot Size
Zoning
128,997 SF
3.04 AC
ESN
Address
Land Use
TOTAL SIZE
Lot Size
Zoning
542,678 SF
0.75 AC
X
Address
Land Use
TOTAL SIZE
Lot Size
Zoning
35,720 SF
0.55 AC
D-1
Address
Land Use
TOTAL SIZE
Lot Size
Zoning
297,476 SF
1.62 AC
CSHBD2
Address
Land Use
TOTAL SIZE
Lot Size
Zoning
549,074 SF
3.45 AC
D-1
The World's #1 Commercial Real Estate Marketplace
Connect with us
© 2026 CoStar Group
The information above has been obtained from sources believed reliable. While we do not doubt its accuracy we have not verified it and make no guarantee, warranty or representation about it. It is your responsibility to independently confirm its accuracy and completeness. Any projections, opinions, assumptions, or estimates used are for example only and do not represent the current or future performance of the property. The value of this transaction to you depends on tax and other factors which should be evaluated by your tax, financial, and legal advisors. You and your advisors should conduct a careful, independent investigation of the property to determine to your satisfaction the suitability of the property for your needs.