For Sale
Denver, CO
Commercial Real Estate Market Trends & Data
$301
Avg asking sale price
$133
Avg asking lease rate
25,360 SF
Avg unit lease size
18,382 SF
Avg building size for sale
6.65%
Average cap rate
Denver's Demographic Profile
Denver has 319,116 households and a median income of $85,001, providing context for rent absorption and tenant demand across retail and multifamily assets. A +1% five-year population trend is a key signal for evaluating long-term demand in this market.
| Key Demographic Metric | Value |
|---|---|
| Population | 716,274 |
| # Households | 319,116 |
| Median age | 37 |
| Median household income | $85,001 |
| Avg household size | 2.0 |
| Renter-occupied housing units | 174,940 |
| 5-year population change | +1% |
{{marketTabHeadings[activeMarketTab]}} Market Metrics Near Denver, CO
↻ Updated Monthly{{marketTabDescriptions[activeMarketTab]}}
| Nearby Office Markets | Avg Cost/SF | Typical Size | Cap Max |
|---|---|---|---|
| Denver | $271 | 13,256 SF | 11.19% |
| Edgewater | $292 | 1,748 SF | 8.67% |
| Commerce City | $355 | 8,830 SF | 5.25% |
| Nearby Industrial Markets | Avg Cost/SF | Typical Size | Cap Max |
|---|---|---|---|
| Denver | $240 | 26,536 SF | 18.83% |
| Welby | $222 | 38,095 SF | 8.23% |
| Henderson | $296 | 5,933 SF | 5.74% |
| Commerce City | $226 | 20,600 SF | 11.70% |
| Nearby Retail Markets | Avg Cost/SF | Typical Size |
|---|---|---|
| Denver | $353 | 9,917 SF |
| Welby | $280 | 7,900 SF |
| Glendale | $656 | 1,980 SF |
| Henderson | $222 | 4,453 SF |
| Edgewater | $292 | 1,748 SF |
| Nearby Multifamily Markets | Avg Cost/SF | Typical Size | Cap Max |
|---|---|---|---|
| Denver | $299 | 17,308 SF | 10.53% |
| Commerce City | $232 | 8,492 SF | 7.69% |
| Greenwood Village | $258 | 27,691 SF | 7.55% |
| Wheat Ridge | $265 | 13,283 SF | 7.58% |
| Englewood | $321 | 19,216 SF | 7.07% |
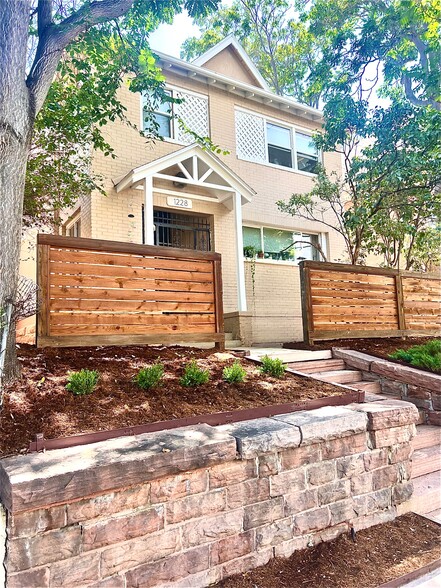
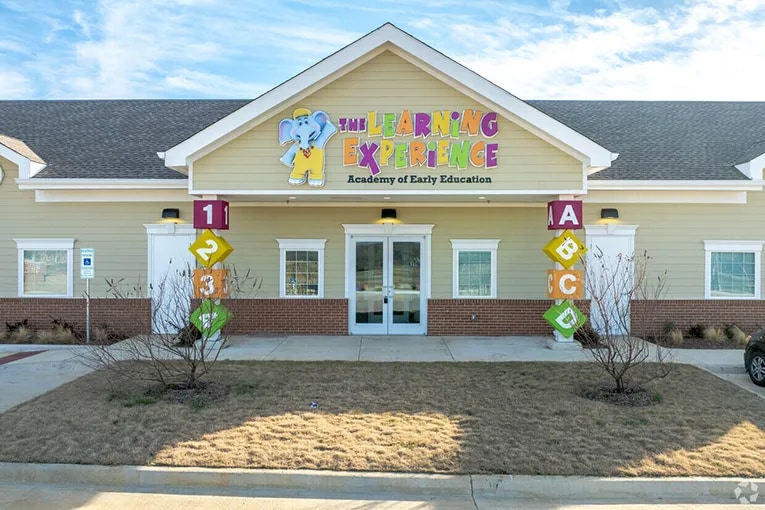
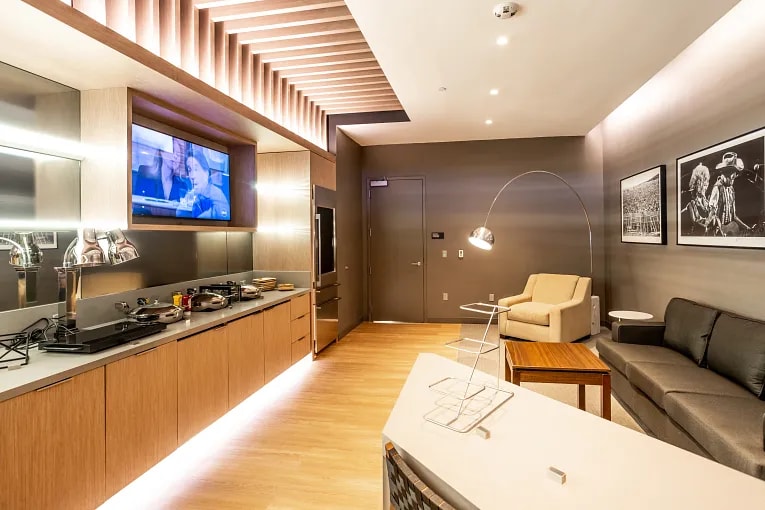
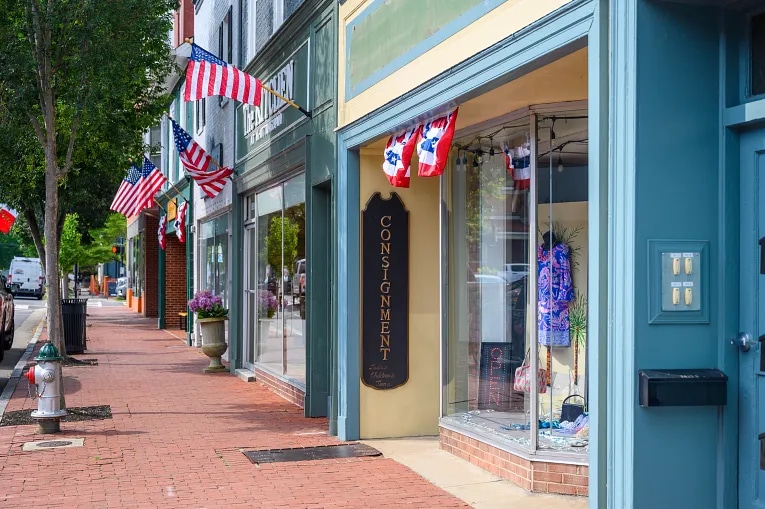
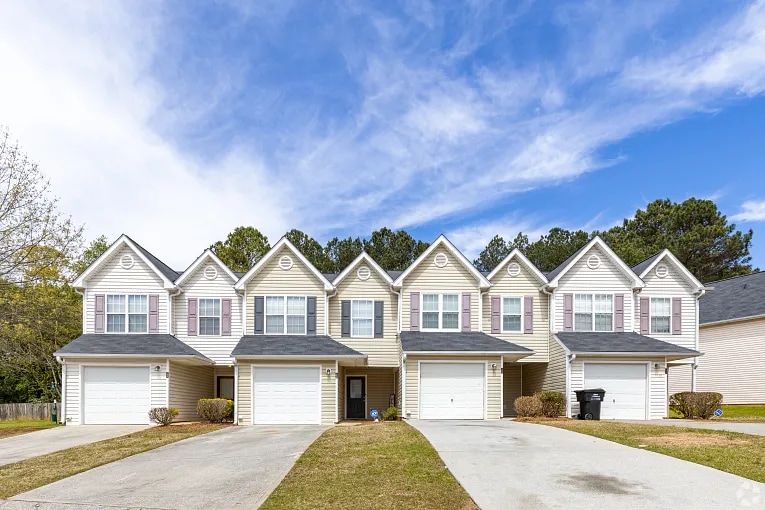
Commercial Properties For Sale in Denver
The listings below reflect how current market pricing and building scale translate into active opportunities available today.


Average Price For Sale
↻ Updated MonthlyAverage Price For Lease
↻ Updated MonthlyNumber of Listings
↻ Updated MonthlyCap Rate
↻ Updated MonthlyHow Investors Evaluate Commercial Real Estate Markets


Nearby Commercial Markets
Comparing nearby markets helps investors see whether Denver pricing and building scale sit above, below, or in line with surrounding areas.
| Commercial Markets | Avg Cost/SF | Average Size |
|---|---|---|
| Denver | $301 | 18,382 SF |
| Welby | $310 | 32,715 SF |
| Glendale | $605 | 4,960 SF |
| Henderson | $342 | 5,625 SF |
| Federal Heights | $455 | 9,625 SF |
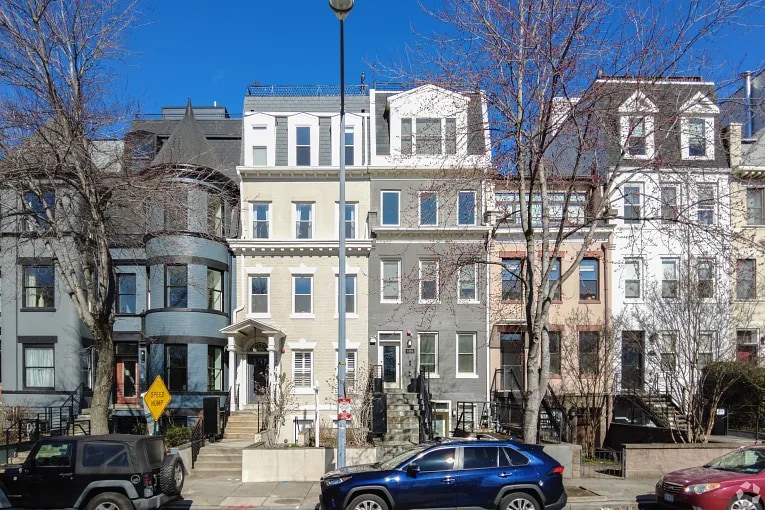
Multifamily Properties For Sale in Denver


Regional Demographic Comparison
This comparison places Denver alongside nearby cities to show how population size, household counts, and income levels differ across the region. Viewing these markets side by side helps investors understand whether local demand and income characteristics are concentrated in Denver or distributed across surrounding areas.
| City | Population | # Households | Age | Median Household Income | Avg Household Size | Renter Occupied Housing Units | Five Yr Pop Growth % |
|---|---|---|---|---|---|---|---|
| Denver | 716,274 | 319,116 | 37 | $85,001 | 2 | 174,940 | 1% |
| Welby | 14,986 | 5,093 | 35 | $64,737 | 3 | 1,650 | 2% |
| Glendale | 5,428 | 3,195 | 33 | $69,087 | 2 | 2,998 | 6% |
| Henderson | 13,281 | 4,116 | 35 | $102,976 | 3 | 794 | 4% |
| Federal Heights | 15,398 | 5,589 | 34 | $50,362 | 3 | 2,654 | 5% |
Disclaimer: The figures on this page reflect LoopNet's active commercial listings in Denver, CO and update as inventory changes. Averages can shift between periods or vary across property types depending on the mix of listings available at a given time, so individual metrics may not reflect broader market trends. These figures are best used as directional benchmarks for early market evaluation. For comprehensive commercial real estate data and analytics, subscribe to CoStar.
FAQs About Commercial Investing in Denver
View All Commercial Real Estate For Sale in Denver
Is Denver a good market for a first-time commercial real estate investor?
Denver offers relatively accessible pricing and clear market benchmarks compared to many major metros, which can help first-time investors set realistic expectations. Reviewing average prices, building sizes, and cap rates on this page can help you understand what a typical deal looks like before narrowing in on specific listings.
How can this market data help me decide whether to buy commercial property for my business in Denver?
The pricing and size metrics on this page help you compare the cost of owning versus leasing space in Denver. By reviewing typical building sizes and asking prices, you can assess whether ownership aligns with your space needs, cash flow goals, and long term business plans before engaging lenders or brokers.
What should conservative investors focus on when evaluating commercial properties in Denver?
Conservative investors often prioritize manageable deal size, reasonable pricing, and return ranges that support steady income. The cap rate and pricing benchmarks shown here help assess whether current Denver market conditions align with lower-risk, income-focused strategies.
How does Denver compare to nearby markets from a pricing and scale perspective?
The nearby market tables highlight how cost per square foot and typical building size vary across the region. These comparisons help experienced investors identify relative value and determine whether Denver pricing is competitive or whether nearby markets may offer better alignment with specific return or scale targets.
How can institutional or high-volume investors use this page for early deal screening in Denver?
This page provides high-level benchmarks on pricing, deal size, and observed cap rates that are useful for initial market filtering. Institutional teams can use these metrics to validate underwriting assumptions, reduce noise, and prioritize Denver listings that meet size and return criteria before deeper analysis.
Nearby Cities
Commercial Market Reports
- Denver Commercial Real Estate Properties
- Welby Commercial Real Estate Properties
- Glendale Commercial Real Estate Properties
- Henderson Commercial Real Estate Properties
- Federal Heights Commercial Real Estate Properties
- Edgewater Commercial Real Estate Properties
- Commerce City Commercial Real Estate Properties
- Thornton Commercial Real Estate Properties
- Cherry Hills Village Commercial Real Estate Properties
- Greenwood Village Commercial Real Estate Properties
- Sheridan Commercial Real Estate Properties
- Wheat Ridge Commercial Real Estate Properties
- Englewood Commercial Real Estate Properties
- Northglenn Commercial Real Estate Properties
- Centennial Commercial Real Estate Properties
- Westminster Commercial Real Estate Properties
- Aurora Commercial Real Estate Properties
- Lakewood Commercial Real Estate Properties
- Foxfield Commercial Real Estate Properties
- Columbine Valley Commercial Real Estate Properties
- Brighton Commercial Real Estate Properties
- Arvada Commercial Real Estate Properties
- Watkins Commercial Real Estate Properties
- Broomfield Commercial Real Estate Properties
- Highlands Ranch Commercial Real Estate Properties
- Lone Tree Commercial Real Estate Properties
- Superior Commercial Real Estate Properties
- Louisville Commercial Real Estate Properties
- View more
- View less
- Atlanta, GA Market Trends
- Austin, TX Market Trends
- Boston, MA Market Trends
- Charlotte, NC Market Trends
- Chicago, IL Market Trends
- Columbus, OH Market Trends
- Dallas, TX Market Trends
- Denver, CO Market Trends
- Fort Worth, TX Market Trends
- Houston, TX Market Trends
- Indianapolis, IN Market Trends
- Jacksonville, FL Market Trends
- Kansas City, MO Market Trends
- Las Vegas, NV Market Trends
- Los Angeles, CA Market Trends
- Nashville, TN Market Trends
- Philadelphia, PA Market Trends
- Phoenix, AZ Market Trends
- San Diego, CA Market Trends
- San Francisco, CA Market Trends
- San Jose, CA Market Trends
- Seattle, WA Market Trends
- Washington, DC Market Trends
- View more
- View less