For Sale
Riverside, CA Commercial Real Estate Market Trends & Data
Commercial Real Estate Market Report
This page offers a quick snapshot of commercial real estate conditions in Riverside, highlighting how current pricing, $439 per square foot, typical deal size, and available inventory shape the market before you dive into individual listings.
Explore Commercial Properties in Riverside
Browse properties currently for sale or lease to see how local market pricing and building sizes translate into real opportunities.
Riverside's Demographic Profile
With a population of 315,768 and a median household income of $81,133, these metrics help investors gauge whether Riverside's pricing reflects local demand fundamentals.
| Key Demographic Metrics | Value |
|---|---|
| Population | 315,768 |
| # Households | 94,445 |
| Median age | 34 |
| Median household income | $81,133 |
| Avg household size | 3 |
| Renter-occupied housing units | 43,754 |
| 5-year population change | 4% |
Commercial Real Estate Market Snapshot in Riverside
These market metrics outline current pricing, typical deal size, and observed cap rate ranges, giving investors a quick read on entry costs and high-level underwriting expectations.
| Key Market Metrics | Value |
|---|---|
| Avg asking sale price | $439 per SF |
| Avg asking lease rate | $1,269 per SF |
| Avg unit size for lease | 19,938 SF |
| Avg building size for sale | 28,143 SF |
| Average cap rate | 5.30% |
In Riverside, commercial properties are currently listed at an average sale price of $439 per square foot, with average lease rates around $1,269 per square foot. Typical leased spaces are approximately 19,938 SF, while properties for sale average 28,143 SF in building size. Observed cap rates average 5.30%, offering a reference point for return expectations relative to pricing and deal scale.
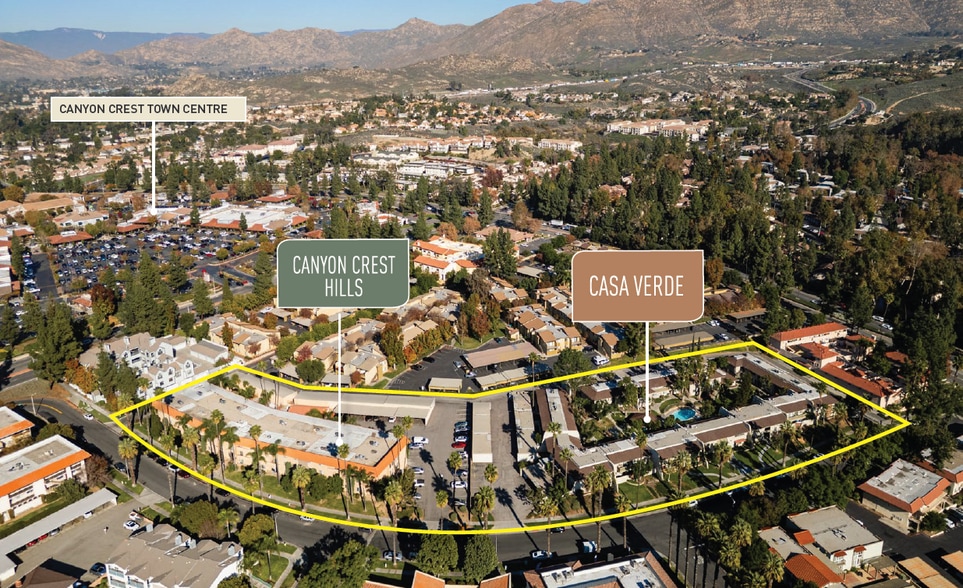
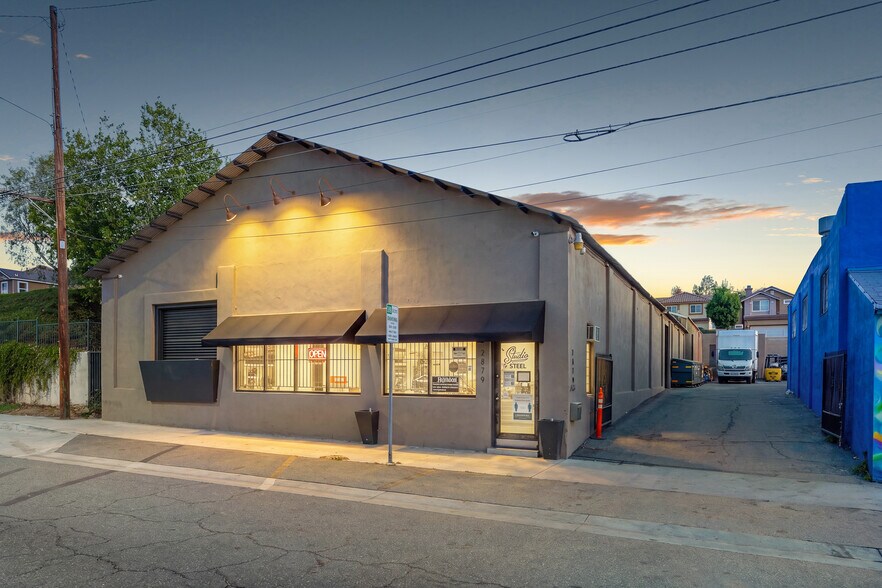
Commercial Properties For Sale In Riverside
The listings below reflect how current market pricing and building scale translate into active opportunities available today.


Commercial Market Metrics by Property Type
Office Building Market Metrics Near Riverside
Office market metrics highlight how pricing, typical deal size, and return expectations vary across submarkets, helping investors compare entry costs and yield potential efficiently.
Industrial Property Market Metrics Near Riverside
Industrial market data shows how cost per square foot and typical building size differ by submarket, supporting comparisons around deal scale and pricing alignment.
| Nearby Industrial Markets | Avg Cost/SF | Typical Size | Cap Max |
|---|---|---|---|
| Riverside | $291 | 37,039 SF | 7.01% |
| Jurupa Valley | $279 | 84,598 SF | 5.80% |
| Colton | $347 | 28,633 SF | 6.03% |
Retail Property Market Metrics Near Riverside
Retail pricing varies widely across nearby markets, making this comparison useful for identifying where cost per square foot and deal size diverge most.
| Nearby Retail Markets | Avg Cost/SF | Typical Size |
|---|---|---|
| Riverside | $643 | 9,500 SF |
| Jurupa Valley | $749 | 19,076 SF |
| Colton | $300 | 14,059 SF |
| Corona | $597 | 40,950 SF |
| Fontana | $538 | 18,560 SF |
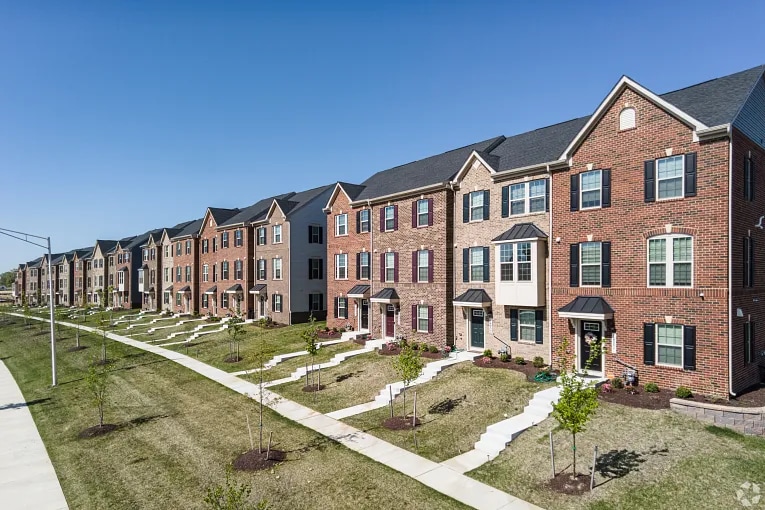
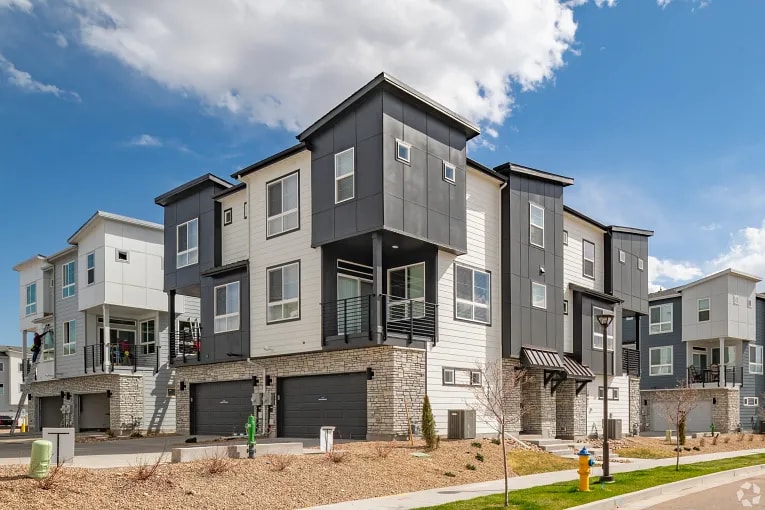
Multifamily Property Market Metrics Near Riverside
Multifamily metrics show how pricing and building size relate to observed cap rate ranges, helping investors evaluate income potential relative to entry cost.
| Nearby Multifamily Markets | Avg Cost/SF | Typical Size | Cap Max |
|---|---|---|---|
| Riverside | $347 | 35,972 SF | 6.55% |
| Moreno Valley | $330 | 11,130 SF | 7.66% |
| San Bernardino | $260 | 13,162 SF | 7.99% |
| Pomona | $351 | 15,307 SF | 6.80% |
| Anaheim | $436 | 13,167 SF | 7.95% |
How Investors Evaluate Commercial Real Estate Markets in Riverside
Use these tools to move from market-level signals to deal-level math. Each calculator helps translate Riverside pricing, rents, and building size into concrete metrics like value, income, and space requirements, so you can validate assumptions before spending time on individual listings.


Nearby Commercial Markets
Comparing nearby markets helps investors see whether Riverside pricing and building scale sit above, below, or in line with surrounding areas.
| Commercial Markets | Avg Cost/SF | Average Size |
|---|---|---|
| Riverside | $439 | 28,143 SF |
| Jurupa Valley | $470 | 51,821 SF |
| Mira Loma | $503 | 124,487 SF |
| Grand Terrace | $851 | 24,804 SF |
| Bloomington | $575 | 34,302 SF |
Office Space For Sale In Riverside
Office listings shown here connect market pricing and size patterns with income-producing opportunities currently available.
For Sale


Regional Demographic Comparison
This comparison places Riverside alongside nearby cities to show how population size, household counts, and income levels differ across the region. Viewing these markets side by side helps investors understand whether local demand and income characteristics are concentrated in Riverside or distributed across surrounding areas.
| City | Population | # Households | Age | MedianHouseholdIncome | AvgHouseholdSize | RenterOccupiedHousingUnits | FiveYrPopGrowthPct |
|---|---|---|---|---|---|---|---|
| Riverside | 315,768 | 94,445 | 34 | $81,133 | 3 | 43,754 | 4% |
| Jurupa Valley | 101,200 | 26,251 | 35 | $87,574 | 4 | 8,657 | 3% |
| Mira Loma | 23,194 | 5,600 | 35 | $98,102 | 4 | 1,388 | 2% |
| Grand Terrace | 13,022 | 4,636 | 38 | $86,916 | 3 | 1,784 | 1% |
| Bloomington | 23,801 | 5,686 | 33 | $70,090 | 4 | 1,813 | 1% |
FAQs About Commercial Investing in Riverside
View All Commercial Real Estate For Sale in Riverside
Is Riverside a good market for a first-time commercial real estate investor?
Riverside offers commercial properties across a wide range of sizes and price points. By reviewing the market data and benchmarks on this page, first-time investors can better understand what a typical commercial property looks like before committing capital and narrowing in on specific listings.
How can this market data help me decide whether to buy commercial property for my business in Riverside?
The pricing and size metrics on this page help business owners compare the cost of ownership against leasing in Riverside. Typical building sizes and asking prices provide a starting point for evaluating space needs, budget fit, and long term occupancy costs before engaging lenders or brokers.
What should conservative investors focus on when evaluating commercial properties in Riverside?
Conservative investors often prioritize manageable deal sizes, stable pricing ranges, and cap rate benchmarks shown for Riverside. These metrics help assess whether current market conditions support steady income potential without relying on aggressive assumptions.
How does Riverside compare to nearby commercial real estate markets?
Nearby market comparisons highlight differences in pricing, building scale, and cap rate ranges relative to Riverside. Reviewing these side by side helps experienced investors identify relative value, pricing premiums, or alternative markets that may better align with return targets.
How can this page support early-stage deal screening for Riverside acquisitions?
This page provides high-level benchmarks for pricing, deal size, and observed cap rates in Riverside, which are useful for initial market filtering. Institutional and data-driven investors often use these signals to prioritize listings that meet size, pricing, and return thresholds before deeper underwriting.
Nearby Cities
Commercial Market Reports
- Riverside Commercial Real Estate Properties
- Jurupa Valley Commercial Real Estate Properties
- Mira Loma Commercial Real Estate Properties
- Grand Terrace Commercial Real Estate Properties
- Bloomington Commercial Real Estate Properties
- Norco Commercial Real Estate Properties
- Colton Commercial Real Estate Properties
- Corona Commercial Real Estate Properties
- Loma Linda Commercial Real Estate Properties
- Perris Commercial Real Estate Properties
- Fontana Commercial Real Estate Properties
- Rialto Commercial Real Estate Properties
- Moreno Valley Commercial Real Estate Properties
- Ontario Commercial Real Estate Properties
- Redlands Commercial Real Estate Properties
- Muscoy Commercial Real Estate Properties
- Chino Commercial Real Estate Properties
- Rancho Cucamonga Commercial Real Estate Properties
- Highland Commercial Real Estate Properties
- Nuevo Commercial Real Estate Properties
- Silverado Commercial Real Estate Properties
- Chino Hills Commercial Real Estate Properties
- San Bernardino Commercial Real Estate Properties
- Calimesa Commercial Real Estate Properties
- Montclair Commercial Real Estate Properties
- Upland Commercial Real Estate Properties
- Homeland Commercial Real Estate Properties
- Lake Elsinore Commercial Real Estate Properties
- View more
- View less
- Atlanta, GA Market Trends
- Austin, TX Market Trends
- Boston, MA Market Trends
- Charlotte, NC Market Trends
- Chicago, IL Market Trends
- Columbus, OH Market Trends
- Dallas, TX Market Trends
- Denver, CO Market Trends
- Fort Worth, TX Market Trends
- Houston, TX Market Trends
- Indianapolis, IN Market Trends
- Jacksonville, FL Market Trends
- Kansas City, MO Market Trends
- Las Vegas, NV Market Trends
- Los Angeles, CA Market Trends
- Nashville, TN Market Trends
- Philadelphia, PA Market Trends
- Phoenix, AZ Market Trends
- San Diego, CA Market Trends
- San Francisco, CA Market Trends
- San Jose, CA Market Trends
- Seattle, WA Market Trends
- Washington, DC Market Trends
- View more
- View less