For Sale
Los Angeles, CA
Commercial Real Estate Market Trends & Data
$522
Avg asking sale price
$399
Avg asking lease rate
25,483 SF
Avg unit lease size
18,411 SF
Avg building size for sale
5.71%
Average cap rate
Los Angeles's Demographic Profile
Los Angeles has 1,372,750 households and a median income of $74,048, providing context for rent absorption and tenant demand across retail and multifamily assets. A -3% five-year population trend is a key signal for evaluating long-term demand in this market.
| Key Demographic Metric | Value |
|---|---|
| Population | 3,789,744 |
| # Households | 1,372,750 |
| Median age | 38 |
| Median household income | $74,048 |
| Avg household size | 3.0 |
| Renter-occupied housing units | 889,182 |
| 5-year population change | -3% |
{{marketTabHeadings[activeMarketTab]}} Market Metrics Near Los Angeles, CA
↻ Updated Monthly{{marketTabDescriptions[activeMarketTab]}}
| Nearby Office Markets | Avg Cost/SF | Typical Size | Cap Max |
|---|---|---|---|
| Los Angeles | $606 | 20,792 SF | 10.80% |
| Palms | $655 | 21,806 SF | 5.77% |
| Culver City | $683 | 17,220 SF | 5.99% |
| Mar Vista | $741 | 5,291 SF | 5.99% |
| Crenshaw | $758 | 18,976 SF | 7.35% |
| Nearby Industrial Markets | Avg Cost/SF | Typical Size | Cap Max |
|---|---|---|---|
| Los Angeles | $403 | 24,009 SF | 9.91% |
| Culver City | $709 | 9,391 SF | 4.14% |
| Crenshaw | $775 | 12,805 SF | 7.35% |
| Nearby Retail Markets | Avg Cost/SF | Typical Size |
|---|---|---|
| Los Angeles | $631 | 9,420 SF |
| Palms | $1,012 | 8,171 SF |
| Culver City | $936 | 7,608 SF |
| Mar Vista | $787 | 5,123 SF |
| Crenshaw | $448 | 7,170 SF |
| Nearby Multifamily Markets | Avg Cost/SF | Typical Size | Cap Max |
|---|---|---|---|
| Los Angeles | $435 | 14,682 SF | 11.81% |
| Palms | $446 | 11,658 SF | 5.99% |
| Culver City | $451 | 10,835 SF | 6.52% |
| Mar Vista | $505 | 18,214 SF | 6.41% |
| Crenshaw | $389 | 11,005 SF | 10.00% |
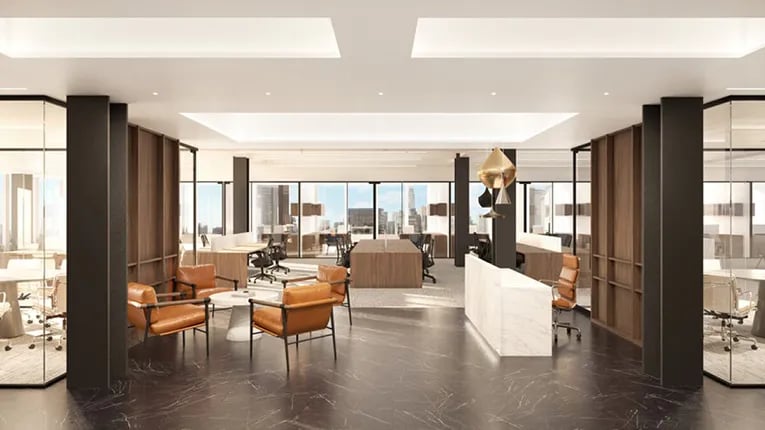
Commercial Properties For Sale in Los Angeles
The listings below reflect how current market pricing and building scale translate into active opportunities available today.

For Sale

For Sale

For Sale

For Sale


Average Price For Sale
↻ Updated MonthlyAverage Price For Lease
↻ Updated MonthlyNumber of Listings
↻ Updated MonthlyCap Rate
↻ Updated MonthlyHow Investors Evaluate Commercial Real Estate Markets


Nearby Commercial Markets
Comparing nearby markets helps investors see whether Los Angeles pricing and building scale sit above, below, or in line with surrounding areas.
| Commercial Markets | Avg Cost/SF | Average Size |
|---|---|---|
| Los Angeles | $522 | 18,411 SF |
| Palms | $863 | 15,530 SF |
| Culver City | $647 | 13,091 SF |
| Mar Vista | $703 | 11,796 SF |
| Crenshaw | $453 | 12,363 SF |
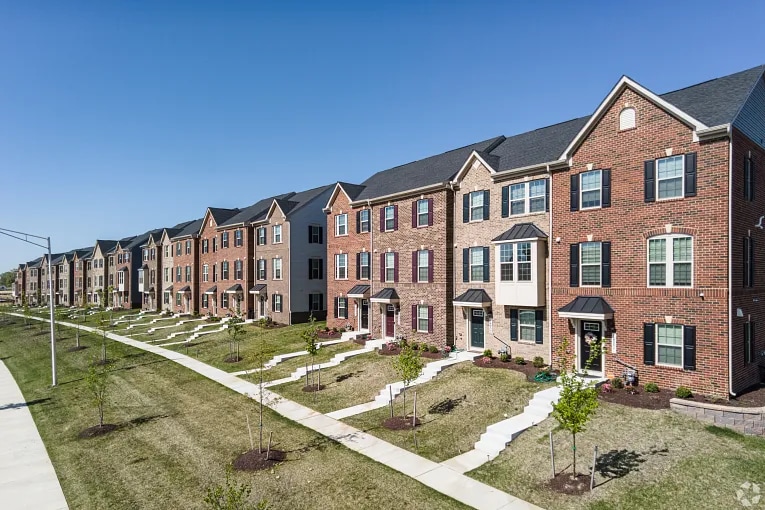
Multifamily Properties For Sale in Los Angeles


For Sale


For Sale


For Sale


Regional Demographic Comparison
This comparison places Los Angeles alongside nearby cities to show how population size, household counts, and income levels differ across the region. Viewing these markets side by side helps investors understand whether local demand and income characteristics are concentrated in Los Angeles or distributed across surrounding areas.
| City | Population | # Households | Age | Median Household Income | Avg Household Size | Renter Occupied Housing Units | Five Yr Pop Growth % |
|---|---|---|---|---|---|---|---|
| Los Angeles | 3,789,744 | 1,372,750 | 38 | $74,048 | 3 | 889,182 | -3% |
| Palms | 58,027 | 26,301 | 37 | $91,437 | 2 | 21,388 | -1% |
| Culver City | 39,379 | 16,234 | 42 | $115,611 | 2 | 7,826 | -3% |
| Mar Vista | 58,895 | 25,514 | 40 | $100,556 | 2 | 16,121 | -2% |
| Crenshaw | 40,995 | 17,348 | 44 | $60,984 | 2 | 10,734 | -2% |
Disclaimer: The figures on this page reflect LoopNet's active commercial listings in Los Angeles, CA and update as inventory changes. Averages can shift between periods or vary across property types depending on the mix of listings available at a given time, so individual metrics may not reflect broader market trends. These figures are best used as directional benchmarks for early market evaluation. For comprehensive commercial real estate data and analytics, subscribe to CoStar.
FAQs About Commercial Investing in Los Angeles
View All Commercial Real Estate For Sale in Los Angeles
Is Los Angeles a good place to start investing in commercial real estate?
Los Angeles offers deep inventory and clear pricing benchmarks, which helps first-time investors understand market norms before making a purchase. Reviewing average prices, building sizes, and nearby market comparisons on this page can help you avoid overpaying and focus on properties that match your budget and risk tolerance.
How can I use this market data to decide if owning commercial property makes sense for my business?
The pricing and size metrics on this page help you compare the cost of ownership against leasing in Los Angeles and nearby markets. By reviewing typical building sizes and asking prices, you can assess whether buying a property fits your space needs and long term financial goals. This data provides a starting point before speaking with lenders or reviewing financing options.
What should conservative investors look for when evaluating Los Angeles commercial properties?
Conservative investors often focus on pricing stability, manageable property size, and return ranges shown in the market data. Reviewing cap rate ranges and multifamily pricing helps assess whether current market conditions support steady income without taking on excessive operational complexity.
How does Los Angeles compare to nearby markets from a pricing and scale perspective?
The nearby market tables highlight meaningful differences in cost per square foot and average building size across surrounding cities. These comparisons help experienced investors spot relative value and determine whether Los Angeles pricing is justified compared to alternative submarkets. Use this data to refine underwriting assumptions and focus on markets that best match your return targets.
How can this page support early-stage deal screening for Los Angeles acquisitions?
This page provides high-level benchmarks on pricing, scale, and cap rate ranges that are useful for initial market filtering. Comparing Los Angeles with nearby markets helps contextualize underwriting assumptions before allocating resources to deal-level analysis. Institutional teams often use this data to reduce noise and prioritize listings that meet size and return thresholds.
Nearby Cities
Commercial Market Reports
- Los Angeles Commercial Real Estate Properties
- Palms Commercial Real Estate Properties
- Culver City Commercial Real Estate Properties
- Mar Vista Commercial Real Estate Properties
- Crenshaw Commercial Real Estate Properties
- Leimert Park Commercial Real Estate Properties
- View Park Commercial Real Estate Properties
- Playa Vista Commercial Real Estate Properties
- West Los Angeles Commercial Real Estate Properties
- Windsor Hills Commercial Real Estate Properties
- Marina Del Rey Commercial Real Estate Properties
- Venice Commercial Real Estate Properties
- Westchester Commercial Real Estate Properties
- Santa Monica Commercial Real Estate Properties
- West Hollywood Commercial Real Estate Properties
- Beverly Hills Commercial Real Estate Properties
- Inglewood Commercial Real Estate Properties
- Playa Del Rey Commercial Real Estate Properties
- Lennox Commercial Real Estate Properties
- Oakwood Commercial Real Estate Properties
- Hollywood Commercial Real Estate Properties
- El Segundo Commercial Real Estate Properties
- Hawthorne Commercial Real Estate Properties
- Universal City Commercial Real Estate Properties
- Los Feliz Commercial Real Estate Properties
- Silver Lake Commercial Real Estate Properties
- Studio City Commercial Real Estate Properties
- Firestone Park Commercial Real Estate Properties
- View more
- View less
- Atlanta, GA Market Trends
- Austin, TX Market Trends
- Boston, MA Market Trends
- Charlotte, NC Market Trends
- Chicago, IL Market Trends
- Columbus, OH Market Trends
- Dallas, TX Market Trends
- Denver, CO Market Trends
- Fort Worth, TX Market Trends
- Houston, TX Market Trends
- Indianapolis, IN Market Trends
- Jacksonville, FL Market Trends
- Kansas City, MO Market Trends
- Las Vegas, NV Market Trends
- Los Angeles, CA Market Trends
- Nashville, TN Market Trends
- Philadelphia, PA Market Trends
- Phoenix, AZ Market Trends
- San Diego, CA Market Trends
- San Francisco, CA Market Trends
- San Jose, CA Market Trends
- Seattle, WA Market Trends
- Washington, DC Market Trends
- View more
- View less