For Sale
Orlando, FL
Commercial Real Estate Market Trends & Data
$501
Avg asking sale price
$730
Avg asking lease rate
22,148 SF
Avg unit lease size
25,713 SF
Avg building size for sale
6.85%
Average cap rate
Orlando's Demographic Profile
Orlando has 137,942 households and a median income of $59,951, providing context for rent absorption and tenant demand across retail and multifamily assets. A +4% five-year population trend is a key signal for evaluating long-term demand in this market.
| Key Demographic Metric | Value |
|---|---|
| Population | 333,013 |
| # Households | 137,942 |
| Median age | 37 |
| Median household income | $59,951 |
| Avg household size | 2.0 |
| Renter-occupied housing units | 87,183 |
| 5-year population change | +4% |
{{marketTabHeadings[activeMarketTab]}} Market Metrics Near Orlando, FL
↻ Updated Monthly{{marketTabDescriptions[activeMarketTab]}}
| Nearby Office Markets | Avg Cost/SF | Typical Size | Cap Max |
|---|---|---|---|
| Orlando | $392 | 27,332 SF | 9.73% |
| Oviedo | $324 | 8,707 SF | 7.10% |
| Alafaya | $671 | 4,483 SF | 9.64% |
| Goldenrod | $325 | 9,461 SF | 6.50% |
| Nearby Industrial Markets | Avg Cost/SF | Typical Size | Cap Max |
|---|---|---|---|
| Orlando | $476 | 23,907 SF | 9.73% |
| Oviedo | $310 | 8,186 SF | 7.10% |
| Winter Springs | $218 | 12,130 SF | 10.74% |
| Nearby Retail Markets | Avg Cost/SF | Typical Size |
|---|---|---|
| Orlando | $592 | 29,107 SF |
| Oviedo | $349 | 3,751 SF |
| Alafaya | $945 | 5,292 SF |
| Winter Springs | $449 | 4,628 SF |
| Goldenrod | $283 | 15,729 SF |
| Nearby Multifamily Markets | Avg Cost/SF | Typical Size | Cap Max |
|---|---|---|---|
| Orlando | $271 | 16,357 SF | 8.19% |
| Titusville | $161 | 14,856 SF | 8.00% |
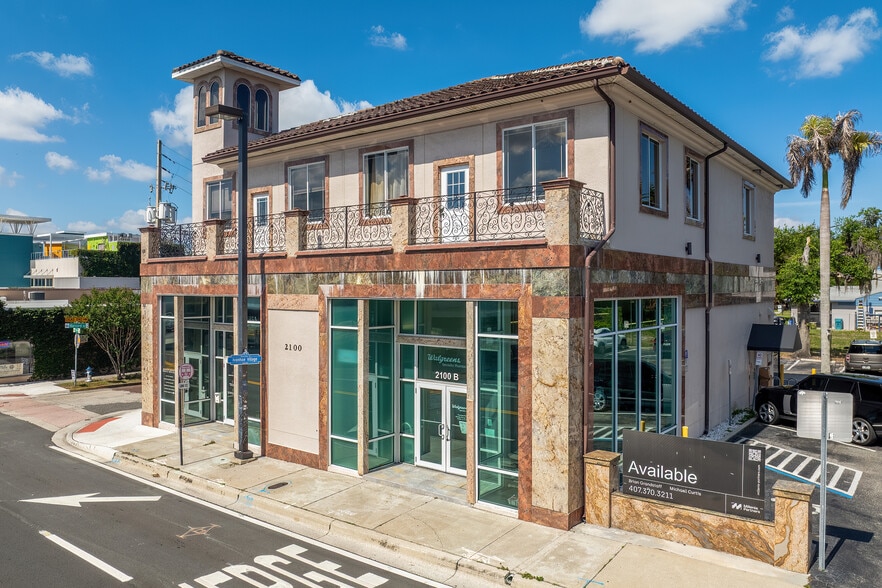
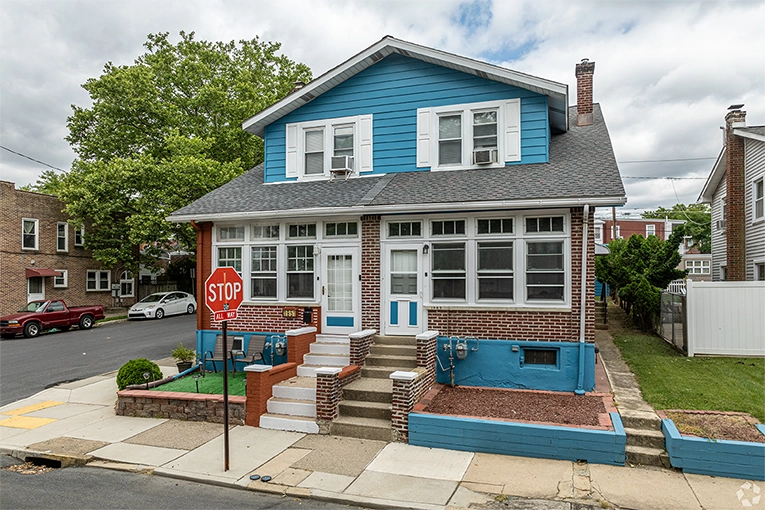
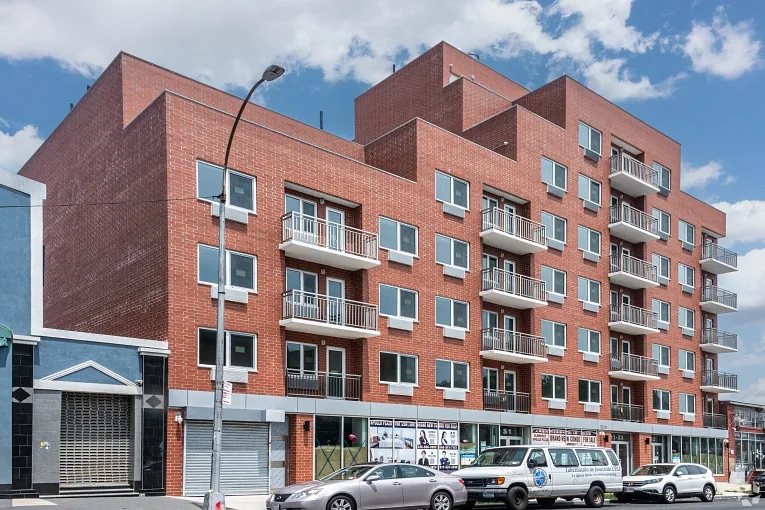
Commercial Properties For Sale in Orlando
The listings below reflect how current market pricing and building scale translate into active opportunities available today.


For Sale
For Sale

For Sale


Average Price For Sale
↻ Updated MonthlyAverage Price For Lease
↻ Updated MonthlyNumber of Listings
↻ Updated MonthlyCap Rate
↻ Updated MonthlyHow Investors Evaluate Commercial Real Estate Markets


Nearby Commercial Markets
Comparing nearby markets helps investors see whether Orlando pricing and building scale sit above, below, or in line with surrounding areas.
| Commercial Markets | Avg Cost/SF | Average Size |
|---|---|---|
| Orlando | $501 | 25,713 SF |
| Oviedo | $459 | 6,672 SF |
| Alafaya | $788 | 4,862 SF |
| Union Park | $492 | 3,317 SF |

Regional Demographic Comparison
This comparison places Orlando alongside nearby cities to show how population size, household counts, and income levels differ across the region. Viewing these markets side by side helps investors understand whether local demand and income characteristics are concentrated in Orlando or distributed across surrounding areas.
| City | Population | # Households | Age | Median Household Income | Avg Household Size | Renter Occupied Housing Units | Five Yr Pop Growth % |
|---|---|---|---|---|---|---|---|
| Orlando | 333,013 | 137,942 | 37 | $59,951 | 2 | 87,183 | 4% |
| Chuluota | 2,669 | 909 | 41 | $90,234 | 3 | 120 | 2% |
| Oviedo | 38,835 | 13,129 | 40 | $101,984 | 3 | 3,568 | 3% |
| Alafaya | 88,056 | 30,279 | 36 | $84,744 | 3 | 12,499 | 1% |
| Union Park | 9,865 | 3,488 | 38 | $65,027 | 3 | 1,442 | 1% |
FAQs About Commercial Investing in Orlando
View All Commercial Real Estate For Sale in Orlando
Is Orlando a good market for a first-time commercial real estate investor?
Orlando offers commercial properties across a wide range of sizes and price points. By reviewing the market data and benchmarks on this page, first-time investors can better understand what a typical commercial property looks like before committing capital and narrowing in on specific listings.
How can this market data help me decide whether to buy commercial property for my business in Orlando?
The pricing and size metrics on this page help business owners compare the cost of ownership against leasing in Orlando. Typical building sizes and asking prices provide a starting point for evaluating space needs, budget fit, and long term occupancy costs before engaging lenders or brokers.
What should conservative investors focus on when evaluating commercial properties in Orlando?
Conservative investors often prioritize manageable deal sizes, stable pricing ranges, and cap rate benchmarks shown for Orlando. These metrics help assess whether current market conditions support steady income potential without relying on aggressive assumptions.
How does Orlando compare to nearby commercial real estate markets?
Nearby market comparisons highlight differences in pricing, building scale, and cap rate ranges relative to Orlando. Reviewing these side by side helps experienced investors identify relative value, pricing premiums, or alternative markets that may better align with return targets.
How can this page support early-stage deal screening for Orlando acquisitions?
This page provides high-level benchmarks for pricing, deal size, and observed cap rates in Orlando, which are useful for initial market filtering. Institutional and data-driven investors often use these signals to prioritize listings that meet size, pricing, and return thresholds before deeper underwriting.
Nearby Cities
Commercial Market Reports
- Orlando Commercial Real Estate Properties
- Chuluota Commercial Real Estate Properties
- Oviedo Commercial Real Estate Properties
- Alafaya Commercial Real Estate Properties
- Union Park Commercial Real Estate Properties
- Geneva Commercial Real Estate Properties
- Winter Springs Commercial Real Estate Properties
- Goldenrod Commercial Real Estate Properties
- Christmas Commercial Real Estate Properties
- Aloma Commercial Real Estate Properties
- Azalea Park Commercial Real Estate Properties
- Casselberry Commercial Real Estate Properties
- Winter Park Commercial Real Estate Properties
- Titusville Commercial Real Estate Properties
- Fern Park Commercial Real Estate Properties
- Maitland Commercial Real Estate Properties
- Sanford Commercial Real Estate Properties
- Osteen Commercial Real Estate Properties
- Eatonville Commercial Real Estate Properties
- Belle Isle Commercial Real Estate Properties
- Altamonte Springs Commercial Real Estate Properties
- Lake Mary Commercial Real Estate Properties
- Longwood Commercial Real Estate Properties
- Edgewood Commercial Real Estate Properties
- Pine Castle Commercial Real Estate Properties
- Heathrow Commercial Real Estate Properties
- Wekiva Springs Commercial Real Estate Properties
- Lockhart Commercial Real Estate Properties
- View more
- View less
- Atlanta, GA Market Trends
- Austin, TX Market Trends
- Boston, MA Market Trends
- Charlotte, NC Market Trends
- Chicago, IL Market Trends
- Columbus, OH Market Trends
- Dallas, TX Market Trends
- Denver, CO Market Trends
- Fort Worth, TX Market Trends
- Houston, TX Market Trends
- Indianapolis, IN Market Trends
- Jacksonville, FL Market Trends
- Kansas City, MO Market Trends
- Las Vegas, NV Market Trends
- Los Angeles, CA Market Trends
- Nashville, TN Market Trends
- Philadelphia, PA Market Trends
- Phoenix, AZ Market Trends
- San Diego, CA Market Trends
- San Francisco, CA Market Trends
- San Jose, CA Market Trends
- Seattle, WA Market Trends
- Washington, DC Market Trends
- View more
- View less